For a decade, marketers and product leaders have worshipped at the altar of Time-on-Site (TOS). We’ve been conditioned to believe that more minutes spent on a page automatically equals deeper engagement.
But in 2026, we need to stop treating utility and transactional websites like social media feeds.
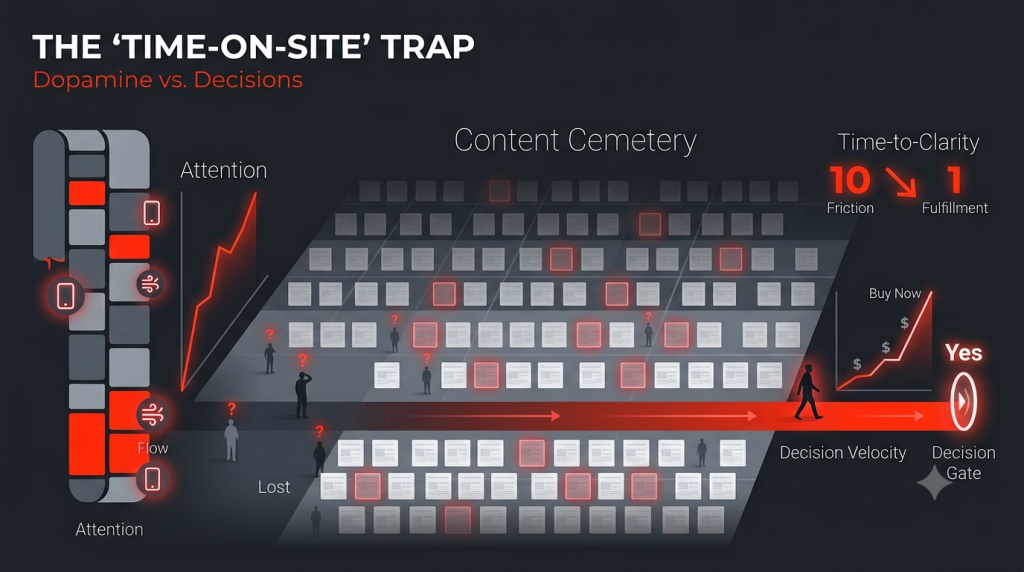
The harsh reality? Unless your business model relies on an algorithmic ‘infinite scroll’, a high TOS isn’t a badge of honour—it’s a massive red flag. It is the primary symptom of a Content Cemetery: a digital maze where your customers are wandering, getting frustrated, and ultimately ghosting your brand.
The Two Economies: Dopamine vs. Decisions
To understand why TOS is a double-edged sword, we must divide the digital landscape into two distinct business models: the Attention Economy and the Efficiency Economy.
| THE ATTENTION ECONOMY | THE EFFICIENCY ECONOMY |
|---|---|
| Dopamine & Consumption Time is the Product. Goal: Keep them scrolling seamlessly. | Decisions & Transactions Time is a Friction Cost. Goal: Help them act cleanly and quickly. |
1. The Attention Economy (Social Media & Entertainment)
For platforms like TikTok, Instagram, or Netflix, time is the product. Their algorithms are engineered for intellectual immersion and the dopamine hit of endless discovery. If a user spends 40 minutes browsing curated feeds, the platform wins. Here, high TOS correlates directly with ad impressions, data collection, and platform health.
2. The Efficiency Economy (Utility, Search, & B2B)
For transactional brands—like Hertz, Amazon, or Salesforce—time is a transaction cost. If a customer is on a car sales site for 15 minutes without clicking “Schedule Test Drive,” they aren’t engaged; they are trapped in a scavenger hunt.
When a user spends too much time on an enterprise documentation page or a travel search result, it is rarely because they want to. It’s because they are paying a Friction Tax—forced to manually integrate fragmented data points just to make a simple decision.
The Clarity Gap: When Browsing Becomes Firefighting
When Time-on-Site spikes on a utility property, it usually signals a widening Clarity Gap. This manifests in two destructive patterns:
- The Scavenger Hunt: A user opens 10 different tabs to compare product specifications because the parent page fails to synthesize the data. TOS goes up, but Decision Velocity plummets.
- The Help-Desk Loop: A prospect digs through a B2B knowledge base for 20 minutes trying to patch a software bug. They aren’t learning about your ecosystem; they are struggling against it.
In these environments, a “sticky” site is actually a broken interface. You aren’t building a relationship; you are building a barrier between your user and the checkout button.
The New KPI: Time-To-Clarity
In the conversational and AI-driven economy, the goalposts have fundamentally shifted. Forward-thinking enterprises are moving their focus from Retention to Resolution.
Success for a modern brand isn’t keeping a user captive on a page for 10 minutes. It’s getting them to an informed, confident “Yes” in 60 seconds. Whether it’s finding an SUV with specific dimensions or troubleshooting a complex SaaS integration, the market share will inevitably flow to the brand that respects the user’s cognitive load.
The TOS Benchmark: Friction vs. Fulfillment
The role of Time-on-Site shifts dramatically depending on your industry. If your TOS is rising while your conversion rate remains flat, you aren’t building a community—you are building a maze.
| Industry | High TOS = Good (Fulfillment) | High TOS = Bad (Friction) | Core Business Outcome |
|---|---|---|---|
| 1. Social & Entertainment (TikTok, Netflix) | The “Flow” State: User is effortlessly consuming an infinite, relevant content stream. | Technical Lag: User is waiting for assets to buffer or fighting a clunky UI. | Revenue via Attention: More minutes directly unlock more ad impressions. |
| 2. E-Commerce & Search (Amazon, Retail) | Curated Discovery: User is happily “window shopping” through personalized collections. | The Scavenger Hunt: User is forced to open 10+ tabs to compare basic specs. | Revenue via Velocity: Success is defined by how fast they confidently hit “Buy Now.” |
| 3. B2B SaaS & Support (Salesforce, ServiceNow) | Deep Training: User is genuinely engaging with a strategic, long-form technical brief. | The Forum Loop: User is digging through outdated 2019 threads for a 2026 bug. | Retention via Resolution: If finding an API key takes 20 minutes, the product feels “hard to use.” |
| 4. News & Media (NYT, Substack) | Intellectual Immersion: The reader is deeply absorbing a 2,000-word investigative analysis. | Clickbait Fatigue: User is wading through pop-ups and ad clutter to find the actual content. | Authority via Depth: Success is measured by the user reaching the finish line of the prose. |
| 5. Travel & Booking (Expedia, Car Rental) | The Planning Phase: User is exploring destination guides and local itineraries. | Comparison Paralysis: User is struggling to find “all-in” pricing or real-time availability. | Conversion via Clarity: The faster the booking is locked in, the lower the risk of abandonment. |
The Bottom Line
Stop bragging about how long people stay on your utility site. Start obsessing over how quickly they find exactly what they need. When a visitor is stuck in your content, they are burning valuable cognitive capital. The moment that mental load exceeds the perceived value of your product, they vanish.
This is why modern digital strategy must pivot toward maximizing Decision Velocity – eliminating “Bad TOS” entirely so users can act while their transactional intent is still at its absolute peak. If your content acts like a cemetery, don’t be surprised when your visitors go silent.